データ分析・初級問題チェック
問題 29 /40
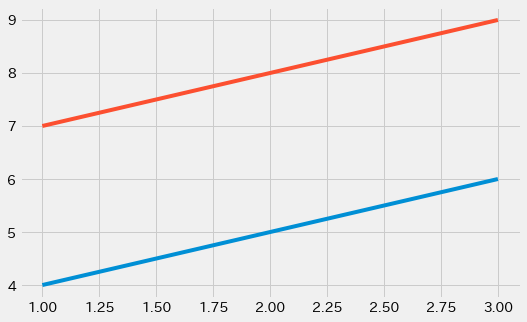
Matplotlibで次の折れ線グラフを描画する場合、正しい記述はどれか。
 x、y1、y2は、次の数値が定義されているものとする。
x = [1, 2, 3]
y1 = [4, 5, 6]
y2 = [7, 8, 9]
x、y1、y2は、次の数値が定義されているものとする。
x = [1, 2, 3]
y1 = [4, 5, 6]
y2 = [7, 8, 9]
選択 1
fig, ax = plt.subplots(2)
ax.plot(x, y1)
ax.plot(x, y2)
選択 2
fig, ax = plt.subplots(2, 2)
ax.plot(x, y1)
ax.plot(x, y2)
選択 3
fig, ax = plt.subplots()
ax.plot(x, y1)
ax.plot(x, y2)
選択 4
fig, ax = plt.subplots()
ax[0].plot(x, y1)
ax[1].plot(x, y2)
解説
選択肢3が正解です。
問題文の折れ線グラフとデータです。
x = [1, 2, 3]
y1 = [4, 5, 6]
y2 = [7, 8, 9]
【選択肢1】
-------------------------------
fig, ax = plt.subplots(2)
ax.plot(x, y1)
ax.plot(x, y2)
-------------------------------
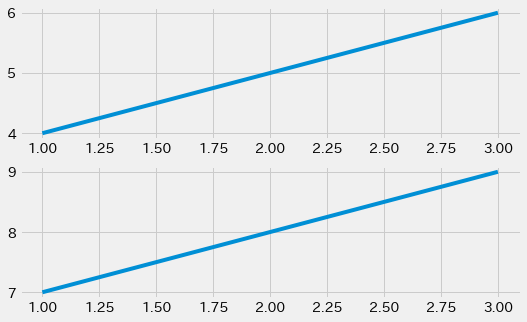
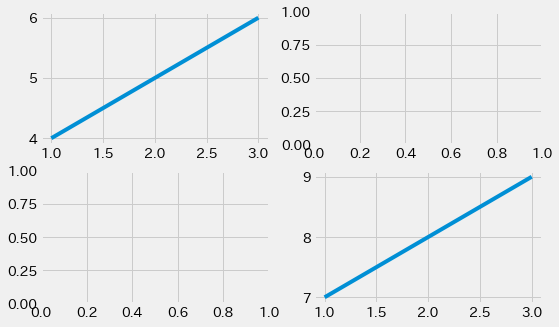
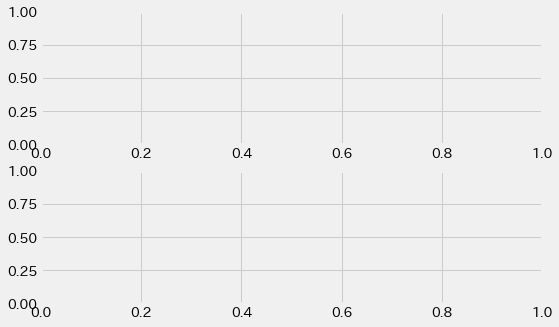 subplotsの引数が「2」となっているため、グラフが縦に2つ並びます。グラフを複数並べた場合は、次のようにaxオブジェクトでインデックスを指定しないとデータが表示されません。
-------------------------------
fig, ax = plt.subplots(2)
ax[0].plot(x, y1)
ax[1].plot(x, y2)
-------------------------------
subplotsの引数が「2」となっているため、グラフが縦に2つ並びます。グラフを複数並べた場合は、次のようにaxオブジェクトでインデックスを指定しないとデータが表示されません。
-------------------------------
fig, ax = plt.subplots(2)
ax[0].plot(x, y1)
ax[1].plot(x, y2)
-------------------------------
 【選択肢2】
-------------------------------
fig, ax = plt.subplots(2, 2)
ax.plot(x, y1)
ax.plot(x, y2)
-------------------------------
【選択肢2】
-------------------------------
fig, ax = plt.subplots(2, 2)
ax.plot(x, y1)
ax.plot(x, y2)
-------------------------------
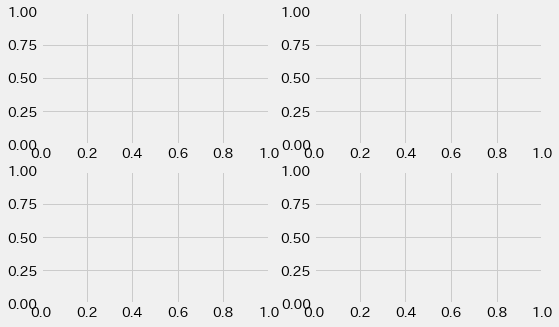 subplotsの引数が「2, 2」となっているため、グラフが2行2列で並びます。選択肢1と同様に、この場合も次のようにaxオブジェクトで行と列のインデックスを指定しないとデータが表示されません。
-------------------------------
fig, ax = plt.subplots(2, 2)
ax[0, 0].plot(x, y1)
ax[1, 1].plot(x, y2)
-------------------------------
subplotsの引数が「2, 2」となっているため、グラフが2行2列で並びます。選択肢1と同様に、この場合も次のようにaxオブジェクトで行と列のインデックスを指定しないとデータが表示されません。
-------------------------------
fig, ax = plt.subplots(2, 2)
ax[0, 0].plot(x, y1)
ax[1, 1].plot(x, y2)
-------------------------------
 【選択肢3】
-------------------------------
fig, ax = plt.subplots()
ax.plot(x, y1)
ax.plot(x, y2)
-------------------------------
問題文と同じグラフになります。1つのグラフに複数のデータを表示する場合、このように「ax.plot」を2つ記述するだけです。
【選択肢4】
-------------------------------
fig, ax = plt.subplots()
ax[0].plot(x, y1)
ax[1].plot(x, y2)
-------------------------------
【選択肢3】
-------------------------------
fig, ax = plt.subplots()
ax.plot(x, y1)
ax.plot(x, y2)
-------------------------------
問題文と同じグラフになります。1つのグラフに複数のデータを表示する場合、このように「ax.plot」を2つ記述するだけです。
【選択肢4】
-------------------------------
fig, ax = plt.subplots()
ax[0].plot(x, y1)
ax[1].plot(x, y2)
-------------------------------
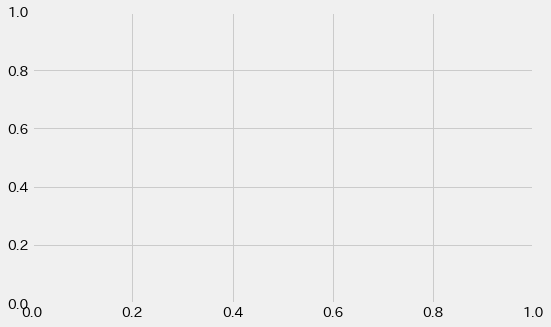 axオブジェクトでインデックスを指定していますが、subplotsの引数がないためグラフは1つです。この場合はデータが表示されません。
(公式書籍 p.186-187)
axオブジェクトでインデックスを指定していますが、subplotsの引数がないためグラフは1つです。この場合はデータが表示されません。
(公式書籍 p.186-187)